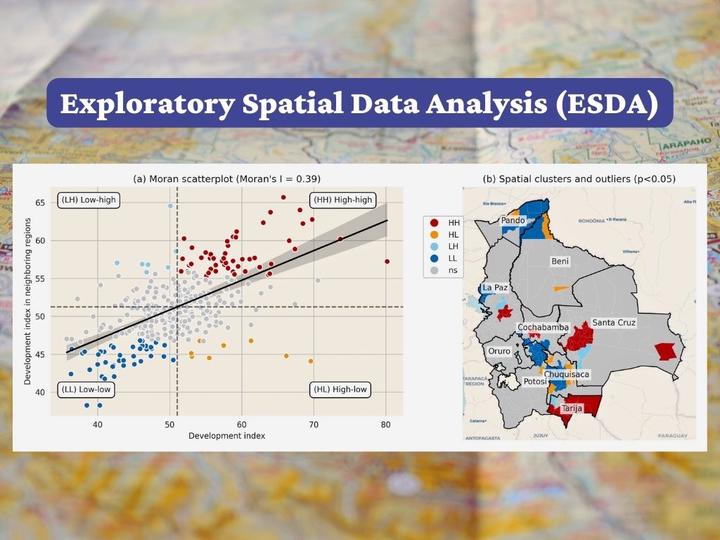
Exploratory Spatial Data Analysis (ESDA)

Exploratory Spatial Data Analysis (ESDA) of Regional Development
This interactive application enables users to explore municipal development indicators across Bolivia. In particular, it offers:
- 🗺️ Geographical data visualizations
- 📈 Distribution and comparative analysis tools
- 💾 Downloadable datasets
- 🧮 Access to a cloud-based computational notebook on Google Colab
⚠️ This application is open source and still work in progress. Source code is available at: github.com/cmg777/streamlit_esda101
📚 Data Sources and Credits
- Primary data source: Municipal Atlas of the SDGs in Bolivia 2020.
- Additional indicators for multiple years were sourced from the GeoQuery project.
- Administrative boundaries from the GeoBoundaries database
- Streamlit web app and computational notebook by Carlos Mendez.
- Erick Gonzales and Pedro Leoni also colaborated in the organization of the data and the creation of the initial geospatial database
Citation:
Mendez, C. (2025, March 24). Regional Development Indicators of Bolivia: A Dashboard for Exploratory Analysis (Version 0.0.2) [Computer software]. Zenodo. https://doi.org/10.5281/zenodo.15074864
🌐 Context and Motivation
Adopted in 2015, the 2030 Agenda for Sustainable Development established 17 Sustainable Development Goals. While global metrics offer useful benchmarks, they often overlook subnational disparities—particularly in heterogeneous countries such as Bolivia.
- 🇧🇴 Bolivia ranks 79/166 on the 2020 SDG Index (score: 69.3)
- 🏘️ The Municipal Atlas of the SDGs in Bolivia 2020 reveals intra-national disparities comparable to global inter-country variation
📊 Development Index: Índice Municipal de Desarrollo Sostenible (IMDS)
The Municipal Sustainable Development Index (IMDS) summarizes municipal performance using 62 indicators across 15 Sustainable Development Goals. However, systematic and reliable information on goals 12 and 14 were not available at the municipal level.
🎯 Methodological Criteria
- ✅ Relevance to local Sustainable Development Goal targets
- 📥 Data availability from official or trusted sources
- 🌐 Full municipal coverage (339 municipalities)
- 🕒 Data mostly from 2012–2019
- 🧮 Low redundancy between indicators
🗃️ Indicators by Sustainable Development Goal
🧱 Goal 1: No Poverty
- Energy poverty rate (2012, INE)
- Multidimensional Poverty Index (2013, UDAPE)
- Unmet Basic Needs (2012, INE)
- Access to basic services: water, sanitation, electricity (2012, INE)
🌾 Goal 2: Zero Hunger
- Chronic malnutrition in children under five (2016, Ministry of Health)
- Obesity prevalence in women (2016, Ministry of Health)
- Average agricultural unit size (2013, Agricultural Census)
- Tractor density per 1,000 farms (2013, Agricultural Census)
🏥 Goal 3: Good Health and Well-being
- Infant and under-five mortality rates (2016, Ministry of Health)
- Institutional birth coverage (2016, Ministry of Health)
- Incidence of Chagas, HIV, malaria, tuberculosis, dengue (2016, Ministry of Health)
- Adolescent fertility rate (2016, Ministry of Health)
📚 Goal 4: Quality Education
- Secondary school dropout rates, by gender (2016, Ministry of Education)
- Adult literacy rate (2012, INE)
- Share of population with higher education (2012, INE)
- Share of qualified teachers, initial and secondary levels (2016, Ministry of Education)
⚖️ Goal 5: Gender Equality
- Gender parity in education, labor participation, and poverty (2012–2016, INE and UDAPE)
- Note: Data on gender-based violence not available at municipal level
💧 Goal 6: Clean Water and Sanitation
- Access to potable water (2012, INE)
- Access to sanitation services (2012, INE)
- Proportion of treated wastewater (2015, Ministry of Environment)
⚡ Goal 7: Affordable and Clean Energy
- Electricity coverage (2012, INE)
- Per capita electricity consumption (2015, Ministry of Energy)
- Use of clean cooking energy (2015, Ministry of Hydrocarbons)
- CO₂ emissions per capita, energy-related (2015, international satellite data)
💼 Goal 8: Decent Work and Economic Growth
- Share of non-functioning electricity meters (proxy for informality/unemployment) (2015, Ministry of Energy)
- Labor force participation rate (2012, INE)
- Youth not in education, employment, or training (NEET rate) (2015, Ministry of Labor)
🏗️ Goal 9: Industry, Innovation, and Infrastructure
- Internet access in households (2012, INE)
- Mobile signal coverage (2015, telecommunications data)
- Availability of urban infrastructure (2015, Ministry of Public Works)
⚖️ Goal 10: Reduced Inequality
- Proxy measures: municipal differences in poverty and participation rates (2012–2016, INE and UDAPE)
🏘️ Goal 11: Sustainable Cities and Communities
- Urban housing adequacy (2012, INE)
- Access to collective transportation (2015, Ministry of Transport)
🌍 Goal 13: Climate Action
- Natural disaster resilience index (2015, Ministry of Environment)
- CO₂ emissions and forest degradation (2015, satellite data)
🌳 Goal 15: Life on Land
- Deforestation rates (2015, satellite data)
- Biodiversity loss indicators (2015, Ministry of Environment)
🕊️ Goal 16: Peace, Justice, and Strong Institutions
- Birth registration coverage (2012, INE)
- Crime and homicide rates (2015, Ministry of Government)
- Corruption perceptions (2015, civil society organizations)
🤝 Goal 17: Partnerships for the Goals
- Municipal fiscal capacity (2015, Ministry of Economy)
- Public investment per capita (2015, Ministry of Economy)
⚠️ Limitations and Future Work
- No disaggregated data for Indigenous Territories (TIOC)
- Many indicators based on 2012 Census; updates pending
- Limited information for Goals 12 and 14 at municipal level
- No indicators for educational quality (due to lack of standardized testing)
- Gender violence data unavailable at municipal scale
🔗 Access
- Original website: atlas.sdsnbolivia.org
- Original Publication: sdsnbolivia.org/Atlas
- Source Code of the Web App: github.com/cmg777/streamlit_esda101
- Computational Notebook: Google Colab