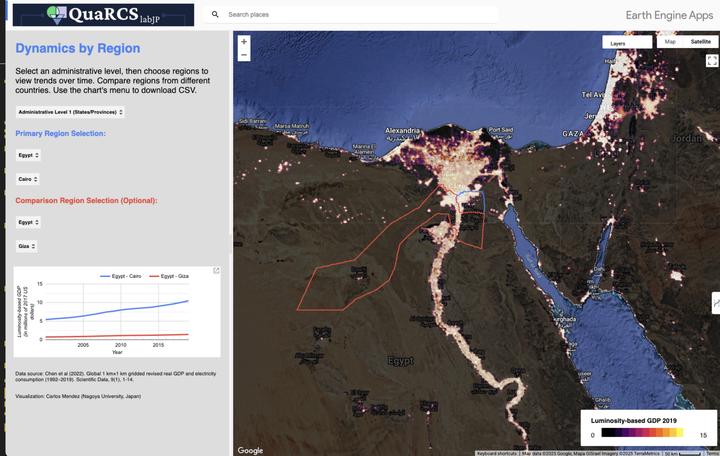
Regional dynamics of luminosity-based GDP 1992-2019
When the sun goes down and the lights turn on, there’s still a lot to explore.
Let’s study regional development from outer space!
Let’s study regional development from outer space!
📊 Global 1 km × 1 km Gridded Revised Real GDP and Electricity Consumption (1992–2019) 🌍
📌 Introduction
- This study presents a high-resolution (1 km × 1 km) global dataset of real GDP and electricity consumption from 1992 to 2019.
- The dataset is based on nighttime light data, calibrated using a novel Particle Swarm Optimization-Back Propagation (PSO-BP) algorithm.
- The aim is to provide a more accurate and continuous measurement of economic activity worldwide.
- Citation: Jiandong Chen, Ming Gao, Shulei Cheng, Wenxuan Hou, Malin Song, Xin Liu & Yu Liu (2022). Nature Scientific Data
💡 Background & Significance
- 📈 GDP and ⚡ electricity consumption are key indicators of economic development.
- Traditional economic statistics often suffer from inconsistencies, especially in developing countries.
- 🛰️ Nighttime light data from satellites has been widely used to estimate economic output, but previous approaches had limitations in accuracy and continuity.
🗂️ Methodology
📚 Data Sources
- 🛰️ Nighttime Light Data:
- Defense Meteorological Satellite Program’s Operational Linescan System (DMSP/OLS)
- National Polar-orbiting Partnership’s Visible Infrared Imaging Radiometer Suite (NPP/VIIRS)
- 📊 GDP Data: Official GDP statistics from 175 countries, revised using nighttime light data.
- ⚡ Electricity Consumption Data: Collected for 134 countries.
⚙️ Data Processing & Calibration
- 🖥️ Image Unification:
- Applied PSO-BP algorithm to standardize DMSP/OLS and NPP/VIIRS data.
- Adjusted for sensor inconsistencies and temporal discontinuities.
- 📍 Grid-Level Estimation:
- GDP and electricity consumption distributed using a top-down approach.
- Revised real GDP growth based on a weighted combination of official statistics and nightlight-derived estimates.
- 🛠️ Correction Mechanisms:
- Eliminated biases in nighttime light intensity.
- Accounted for regional heterogeneity in economic activities.
- Applied inter-annual continuous series correction to ensure temporal consistency in nighttime light data.
🔍 PSO-BP Algorithm for Data Calibration
🔄 Training Process:
- Used artificial neural networks to train a model mapping relationships between GDP, electricity consumption, and nighttime light intensity.
- Divided the data into training (60%) and testing (40%) samples.
- Applied Particle Swarm Optimization (PSO) to optimize the Back Propagation (BP) neural network.
- Iterated 50 times with 20 population size to refine model accuracy.
📉 Data Matching Across Sensors:
- Addressed discrepancies between DMSP/OLS (1992–2013) and NPP/VIIRS (2012–2019) by:
- Applying pixel-level calibration.
- Ensuring consistency in spatial patterns by matching high/low DN values.
- Normalizing DN values and applying machine learning for seamless integration.
- Addressed discrepancies between DMSP/OLS (1992–2013) and NPP/VIIRS (2012–2019) by:
📊 Estimation of GDP and Electricity Consumption:
- Derived GDP growth rate as a function of official GDP and nighttime light data.
- Applied weights (ρ = 0.94 for developed countries, ρ = 0.66 for developing countries) to adjust official GDP growth.
- Estimated electricity consumption growth using a combined function of GDP and light intensity growth.
🔬 Technical Validation
✔️ Validity Testing for Nighttime Light Data
- 🏙️ Urban Built-up Areas Validation: Compared estimated urban built-up areas with official MCD12Q1 land cover data, showing high accuracy.
- 🌎 Cross-sectional Analysis: Strong correlation (R² ~ 0.87) between sum of DN values and national GDP/electricity consumption.
- Validated temporal consistency of corrected light data across years.
🤖 Validation of PSO-BP Algorithm
- Trained the PSO-BP model using national GDP, electricity consumption, and nighttime light data.
- Achieved an R² > 0.99 in training and testing datasets, confirming model robustness.
- Outperformed previous models with improved spatiotemporal consistency.
- Compared simulated GDP/electricity consumption with external datasets, showing strong alignment.
📊 Key Findings
- 📈 Improved GDP Estimation:
- The revised GDP dataset offers better accuracy than official statistics, particularly for developing nations.
- Provides a more granular view of economic activities at a local level.
- ⚡ Electricity Consumption Trends:
- The dataset captures industrial and residential electricity use trends.
- Highlights regional disparities in energy access and usage.
- 📊 Validation Results:
- High correlation (R² > 0.96) between estimated and actual GDP/electricity consumption values.
- Comparison with external data sources shows significant improvement over previous models.
🌎 Applications & Implications
- 📊 Economic Research:
- Enables detailed studies on economic growth patterns.
- Useful for policy-making in regional development.
- ⚡ Energy Policy & Planning:
- Helps in assessing energy demand and infrastructure needs.
- Supports sustainable energy policy formulation.
- 🌪️ Disaster Impact Analysis:
- Can be used to evaluate economic impacts of natural disasters.
- Provides data for rapid response planning.
✅ Conclusion & Takeaways
- This dataset provides a valuable tool for researchers, economists, and policymakers.
- The methodology ensures high accuracy and continuity over nearly three decades, offering new insights into global economic trends.
- The dataset enables micro-level analysis, particularly for regions with poor economic statistics.
- The integration of satellite-derived economic indicators with official statistics enhances data reliability.
- Future improvements may include:
- Integration with additional socioeconomic indicators to enhance model robustness.
- Refinements in machine learning techniques to further reduce errors in estimation.
- Expanding coverage to additional datasets that improve understanding of regional economic disparities.
📖 References
- Full dataset and methodology details are available at Nature Scientific Data.
- GEE dataset Access: Awesomme GEE community catalog
- Exploratory Tool: GEE web app by Carlos Mendez
See app in full screen HERE
Carlos Mendez
Associate Professor of Development Economics
My research interests focus on the integration of development economics, spatial data science, and econometrics to understand and inform the process of sustainable development across regions.