Causal effects of a CO2 tax
Many economists concur that the primary tool for addressing climate change in a cost-effective way should be pricing greenhouse gas emissions, either through emission certificates or a carbon tax. In 1991, Sweden implemented a progressively increasing Carbon tax, which reached a peak of 110 Euros per ton of CO2 in 2020, making it the highest carbon tax globally. This tax is applicable to sectors not covered by the EU emission trading system, primarily transportation and residential heating.
Two critical questions related to this tax are:
What was the impact of the carbon tax on reducing Sweden’s carbon emissions?
How did the tax influence Sweden’s economic growth, as measured by GDP growth?
The paper “Carbon Taxes and CO2 Emissions: Sweden as a case study” (2019, AEJ: Economic Policy) by Julius J. Andersson calculates the direct impact of Sweden’s CO2 tax on emissions in the transportation sector using the synthetic control model.
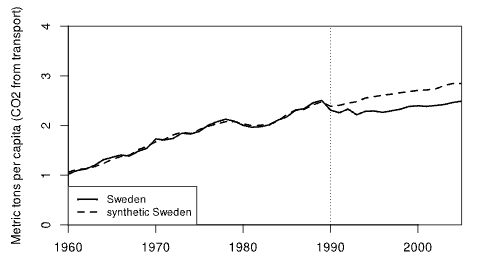
The fundamental concept is to use a synthetic Sweden as a control group, which is constructed as a weighted sample of other countries. The weights assigned to each country are determined through a nested optimization process that assigns higher weights to countries that, during the pre-intervention period, were more similar to Sweden in terms of certain explanatory variables, such as GDP per capita or the proportion of the urban population. These explanatory variables are weighted to ensure that the constructed synthetic Sweden closely matches Sweden’s pre-intervention emission levels over time.
As part of her Master’s Thesis at Ulm University, Theresa Graefe developed an excellent RTutor problem set that allows you to replicate the analysis and delve deeper into the synthetic control method interactively with R. As with previous RTutor problem sets, you can input free R code into a web-based shiny app. The code is automatically checked, and you can receive hints on how to proceed. Additionally, you are challenged with multiple-choice quizzes. This guidance will help you learn how to create plots like the one below, which illustrates the estimated causal effects' time path as the post-treatment difference between Sweden’s and synthetic Sweden’s CO2 emissions:

In similar plots, you’ll observe that the CO2 tax had virtually no discernible causal effect on Sweden’s GDP growth. You’ll also learn about Placebo tests, which aid in assessing the statistical significance (often informally) of the estimated causal effects.
You can try the problem set online at shinyapps.io:
https://theresagraefe.shinyapps.io/RTutorCarbonTaxesAndCO2Emissions/
Please note that the free shinyapps.io account has a usage limit of 25 hours per month. Therefore, it might be unavailable when you attempt to access it. For that reason, I loaded the app in Posit cloud containter:
https://posit.cloud/content/6187268
To run the app in Posit cloud, you need to register for a free account. Then, run the following code in the console.
library(RTutor)
run.ps(user.name="Jon Doe", package="RTutorCarbonTaxesAndCO2Emissions", load.sav=TRUE, sample.solution=FALSE)
To install the problem set locally, follow the installation instructions at the problem set’s Github repository: https://github.com/TheresaGraefe/RTutorCarbonTax
If you’re interested in learning more about RTutor, trying out other problem sets, or creating your own problem set, visit the Github page:
https://github.com/skranz/RTutor
or check out the documentation at:
Carlos Mendez
Associate Professor of Development Economics
My research interests focus on the integration of development economics, spatial data science, and econometrics to understand and inform the process of sustainable development across subnational regions and countries.